Career Research Data Charts
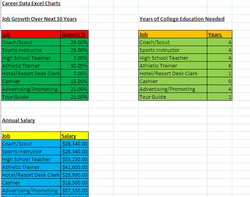
In this activity I researched what type of career would be best for me. After that I then researched things like average annual salaries for each job, how many years of college education is needed for each job and the expected job growth over the next 10 years for each job. After that I put my data into charts on Microsoft Excel. The technology skills needed for this activity would be how to use Microsoft Word and how to use and make charts in Microsoft Excel. Something I did well on in this activity was putting the data in charts on Microsoft Excel. Something I need to work on is how to put data into charts on Microsoft Word. I also need to organize the chart a little better as the finished product looked messy and many columns and rows were all different sizes.
